Three Bullish Signals from the First Quarter
“We may not know where we are going, but we better know where we stand.” — Howard Marks, Co-Founder of Oaktree Capital Management
- The S&P 500 was down 0.9% last week, getting the first quarter off to a slow start.
- A strong first quarter still suggests a positive outlook, but some bumps along the way are normal and even healthy.
- The U.S. economy continues to look solid, with markets rallying Friday after a stronger-than-expected jobs report.
- Market fundamentals show earnings growth has been the main driver of stock growth amid strong revenue growth and stable margins.
- Pockets of attractive valuations exist despite above-average valuations in some high-profile areas of the market.
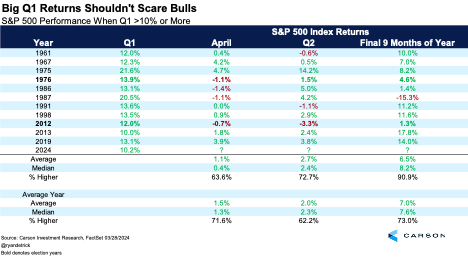
Following the huge 11.2% rally for the S&P 500 in the fourth quarter of 2023, the index provided an encore performance in the first quarter with a 10.2% gain. Big gains like this in Q1 aren’t common. The S&P 500 has gained more than 10% in the first quarter only 11 times in its history, and what followed was typically good for the bulls.
April gained 1.1% on average following those 11 big first quarters, not quite the average 1.5% gain, but not a bad number by any means. In the second quarter, the returns improved, and the rest of the year was higher 10 out of 11 times with a solid 8.2% median return. The one time things didn’t work out was in 1987, but stocks were up 40% for the year in August, so they were much more stretched than now. The bottom line: A big first quarter could indicate the bull market is alive and well.
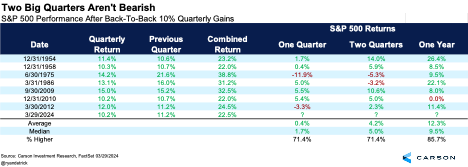
If a 10% first quarter is rare, back-to-back double-digit quarters are even more so. This is only the eighth time that has ever happened and the first time since the first quarter of 2012 (also an election year). The following one- and two-quarter returns aren’t much to get excited about, but after a huge move some consolidation is normal. One year later, however, stocks were higher six out of seven times and up 12.1% on average. Again, this is likely a positive sign of continued strength from stocks.
One of our favorite indicators at Carson Investment Research is the December Low Indicator, which is fairly straightforward. When the S&P 500 doesn’t close beneath the December low in the first quarter, the market has typically been positive the rest of the year. The opposite, of course, is when the December lows are violated in the first quarter. Last year, the S&P 500 didn’t break the December low, and it was a great year. However, a break in early 2022 indicated elevated odds that the rest of the year could be dicey. Given that stocks didn’t break their December low this year, this signal is less worrisome.
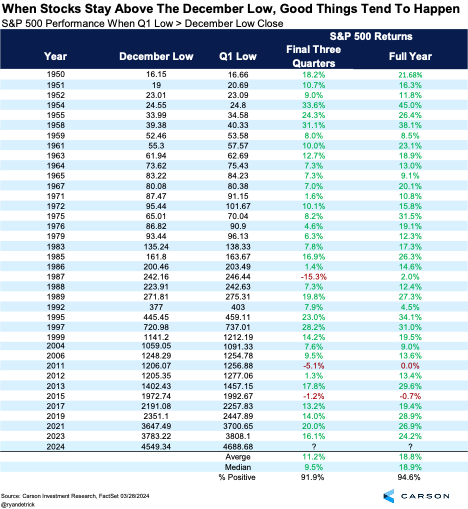
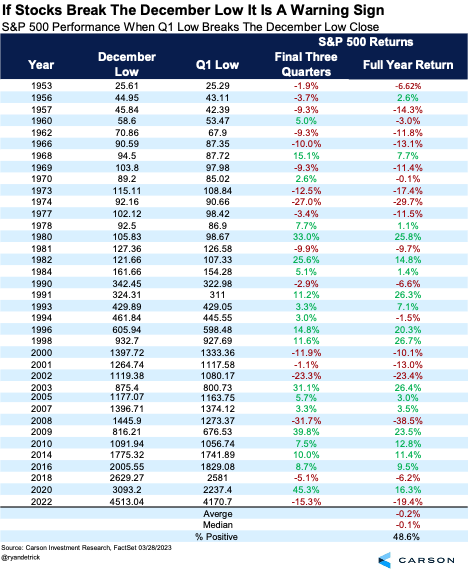
Interestingly, since 1950 stocks held above the December lows 37 times while they broke the lows 37 times. Talk about even-steven. Those are pretty big sample sizes, and the results are quite conclusive.
When the December lows held, the full year was up an incredible 35 times for an average of 18.8%. When the lows broke, the full year was down 0.2% on average and higher less than 50% of the time.
The chart below shows all 37 times the S&P 500 held above the December lows. We added what happened the rest of the year (the following three quarters), which showed strong performance was quite normal. We realize anything could happen, but it would be abnormal to see a massive bear market and a horrible year for stocks.
The chart below shows each instance the December lows were broken. The full year and the following three quarters’ returns were much weaker. These include some of the worst years in stock market history, including 1973, 1974, the tech bubble, 2008, and 2022.\
Of course, markets will ultimately respond to movement in the economy and corporate America, which we discuss below. But these historical patterns are a useful starting guide. At the very least, they suggest we should not be concerned just because the market has been doing well. Just the opposite — history shows it makes sense to expect more strength over the year, even if there are bumps along the way.
A Blockbuster Payroll Report Suggests the Economy Is Far from Recession
One factor we think will continue to support markets is the strength of the U.S. economy, and the job market is leading the way. The labor market has provided continuous positive news in recent months — job growth has been strong, and the unemployment rate has been below 4% for 26 straight months (the longest streak since the late 1960s). However, there were some concerning issues at the margins if you looked hard enough. The March payroll report, released Friday, set aside many of these worries as it was positive across the board.
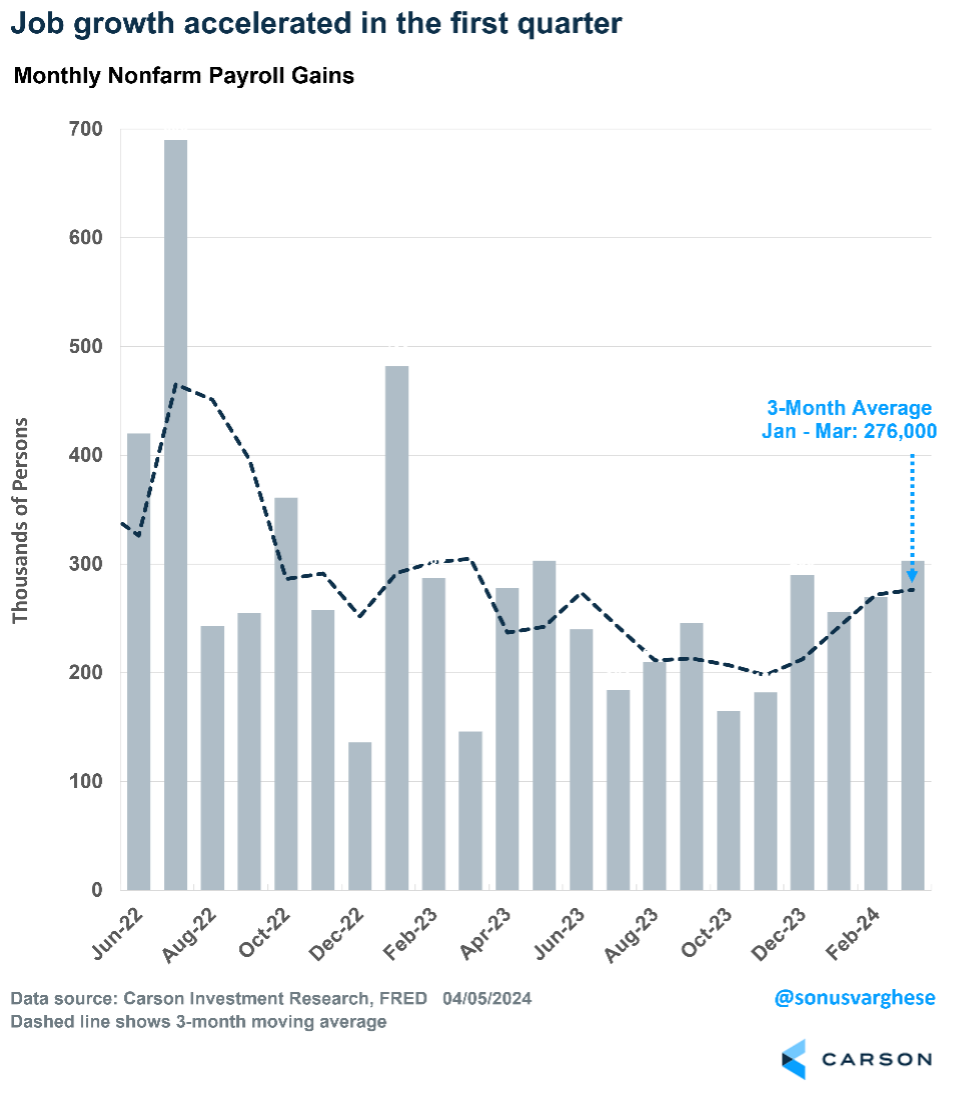
Payroll growth picked up in recent months. The economy created 303,000 net new jobs in March, which was well above expectations for a 214,000 increase. With positive revisions to January and February, payroll growth averaged 276,000 a month in the first quarter. That’s coming off an average of 212,000 in the fourth quarter of 2023. For perspective, payroll growth averaged 166,000 in 2019.
Much of the employment growth over the past year has come from non-cyclical sectors, such as health care, education, and government, but only because these sectors lagged the initial recovery in 2021-2022. However, cyclical areas are bouncing back. Payroll growth in the goods-producing sector, along with retail trade and leisure and hospitality, saw 109,000 jobs created in March. That alone is almost enough to keep up with population growth.
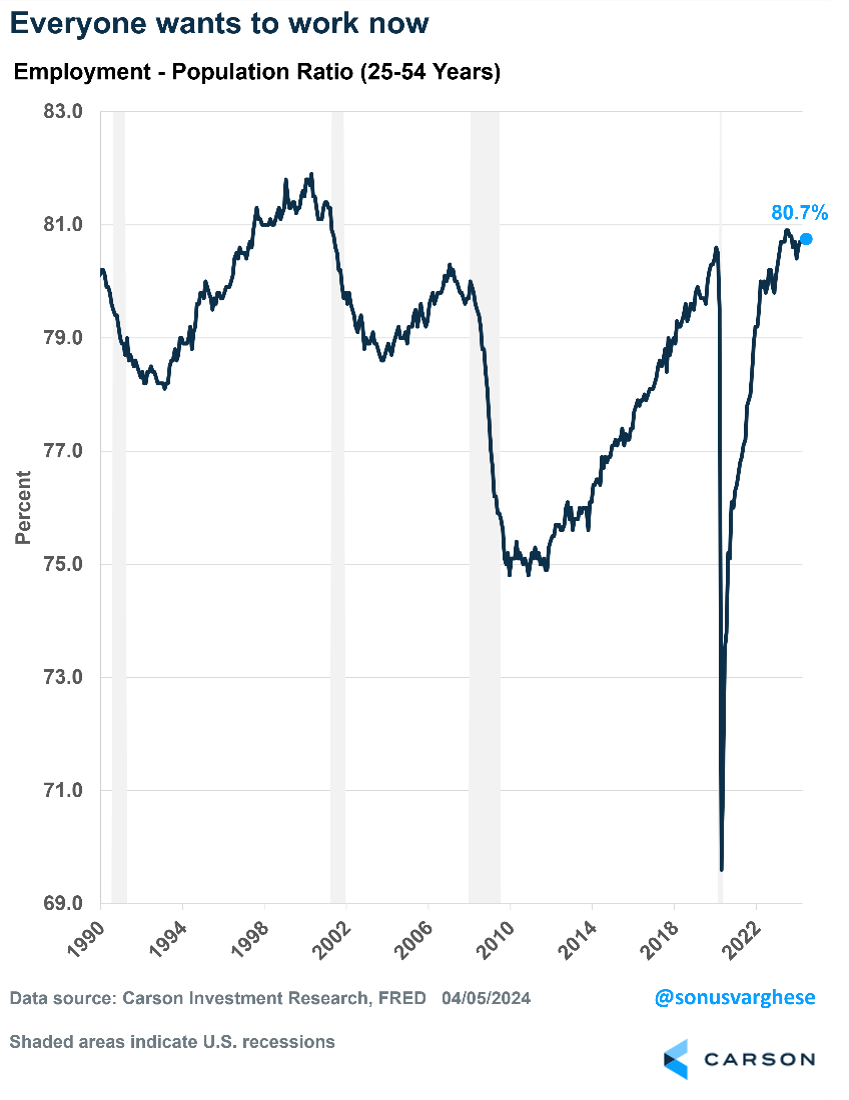
The unemployment rate had risen from 3.4% last April to 3.9% in February, raising concerns among some investors. There was a welcome pullback to 3.8% in March. That’s still higher than a year ago, but not by much. Moreover, higher rates of immigration are increasing the supply of workers, and there’s a lag between when new immigrants enter the workforce and how quickly they find jobs. In any case, I prefer the “prime-age” employment-population ratio, which shows how many people in their prime working years (25-54) are employed relative to the population. The measure is at 80.7%, exactly where it was a year ago and higher than at any point between July 2001 and February 2020. That shows how strong the labor market and economy are, with a higher proportion of prime-age adults working now than over the last two expansions.
But does a strong labor market raise inflation concerns?
A strong labor market would typically raise the prospect of higher inflation. The logic is that a hot labor market results in higher wage growth, which increases demand for goods and services, resulting in higher inflation. However, wage growth has eased since 2022, and that hasn’t changed despite the recent acceleration in hiring.
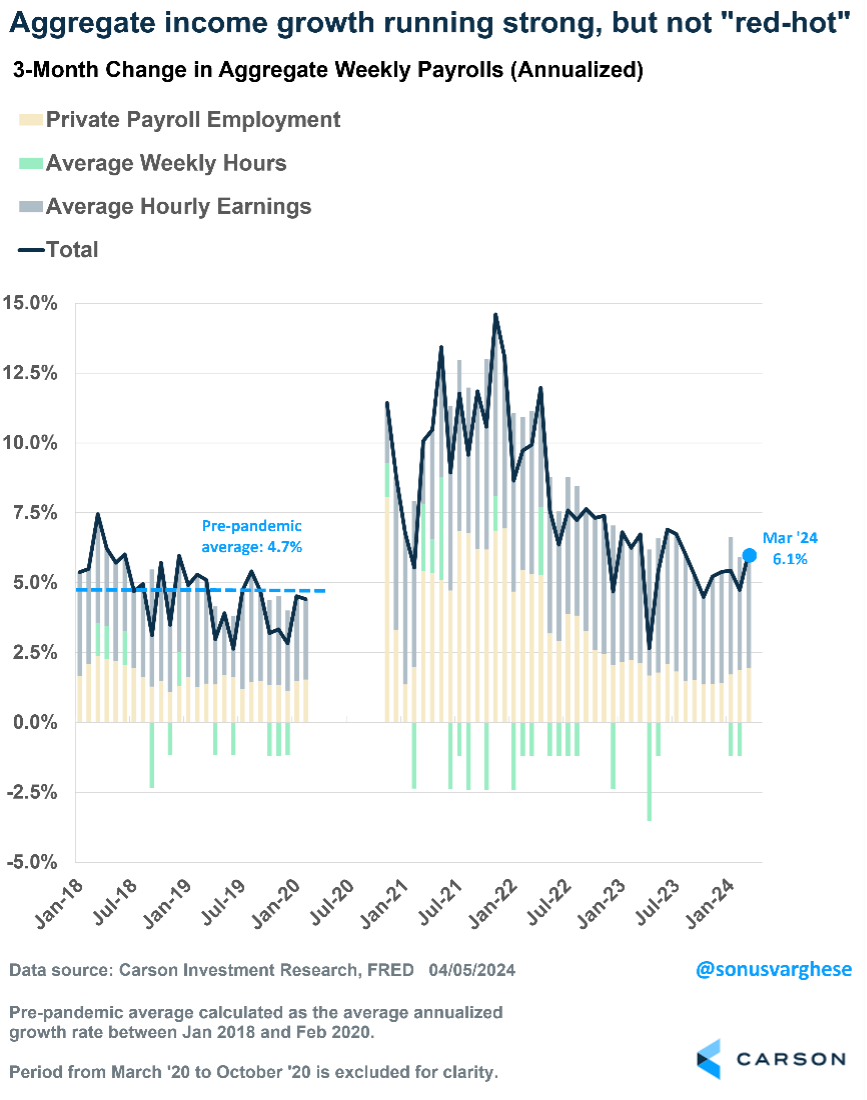
Overall income growth across all workers in the economy (a product of employment growth, hourly wage growth, and hours worked) has run at a 6.1% annualized pace over the last three months. That’s stronger than the pre-pandemic rate, when aggregate income growth averaged about 4.7% annualized, but well off the red-hot levels of 10%+ in 2021-2022 when inflation surged.
Moreover, two notable points pop out when reviewing aggregate income.
One, income growth is running ahead of inflation. After adjusting for inflation, aggregate income rose at an annualized pace of about 2% in the first quarter (assuming the Fed’s preferred inflation metric, the personal consumption expenditures index, rose at a 4.1% annualized pace in Q1). That’s positive for consumption and the economy.
Two, hours worked has run flat recently (the green bars in the chart above). At the same time, GDP growth in the first quarter is estimated around 2.5% (using the Atlanta Fed GDP “Nowcast”). That means labor productivity continues to run strong, as workers are producing above-trend output while working the same number of hours.
Higher productivity was a key theme in our 2024 Outlook, and it’s encouraging to see signs of that continuing, mostly thanks to a strong labor market drawing in more workers, including immigrants. As we’ve written in the past, productivity growth allows for strong wage growth with muted inflation, which is positive in two ways:
- Some of the productivity growth is taken by firms in the form of margin growth. (Firms don’t pass all the productivity gains to workers, much as we’d all like our employers to do that.)
- Muted inflation in the face of a strong labor market means the Fed can start to ease rates, which will potentially fuel investment and provide a further boost to productivity.
With respect to potential interest-rate cuts by the Federal Reserve, the strong labor market and economy doesn’t preclude cuts. Of course, the inflation data needs to cooperate, but we do expect inflation to pull back in March and April, reversing the firming that occurred during the first two months of the year. The good news is there’s nothing in the economic data that suggests we’re on the verge of a labor-market-induced inflation surge. While some commodity prices are rising amid tensions in the Middle East, these events are volatile and prices can reverse just as quickly.
Checking on the Fundamentals
Another strong quarter in the markets can be met with skepticism if the fundamentals are not keeping up with price returns. Quarter-end is a great time to dive in and review the health of equity performance and discover opportunities here and abroad.
Earnings
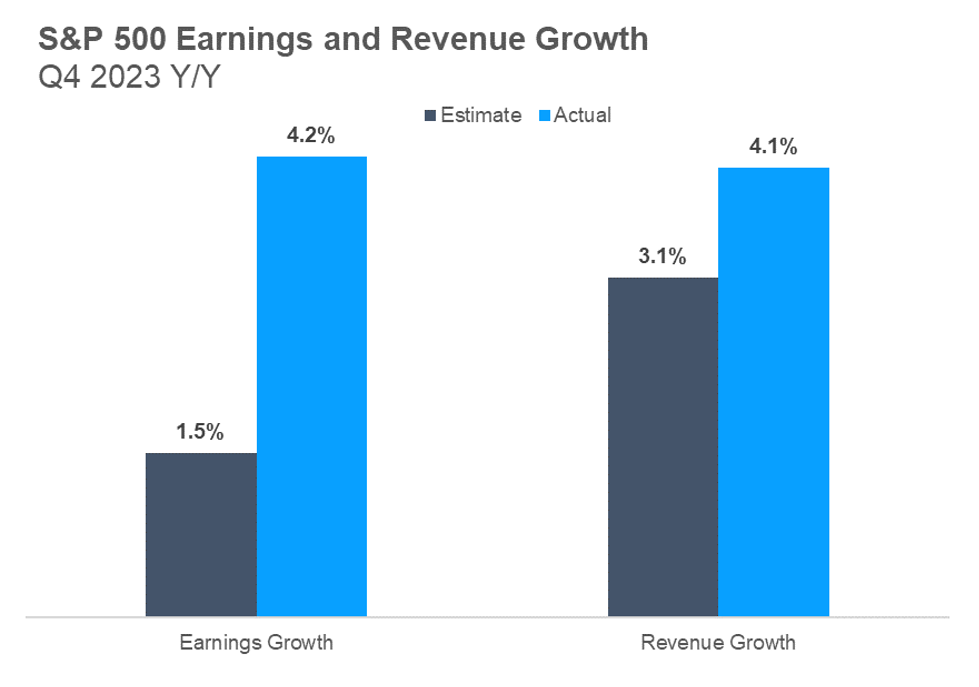
Over the long term, earnings growth drives stock prices. Over the last five years, earnings have contributed more to stock price growth than other factors, specifically multiple expansion (stocks getting more expensive). Throughout the first quarter, earnings results for the fourth quarter of 2023 were reported. Not surprisingly, companies continue to exceed expectations and prove their resilience. Prior to the reporting season, analysts expected S&P 500 companies to grow earnings by 1.5% and revenues by 3.1%. As it turns out, 73% of companies exceeded earnings estimates, and another 65% beat on revenues — both numbers are above recent and long-term averages. This resulted in 4.2% reported earnings growth and 4.1% reported revenue growth, which are strong year-over-year numbers.
Source: Factset 3/28/2024
Technology-related sectors led the growth, but strength expanded to other areas such as industrials and even recent laggards, utilities and real estate. Technology, industrials, and health care exceeded estimates by more than any other sector.
The term AI was mentioned on earnings calls for nearly 180 S&P 500 companies. Companies that mentioned AI outperformed those that did not by more than 12% over the prior year. With that information and the benefit of hindsight, it is somewhat surprising that more companies haven’t mentioned AI!
Margins
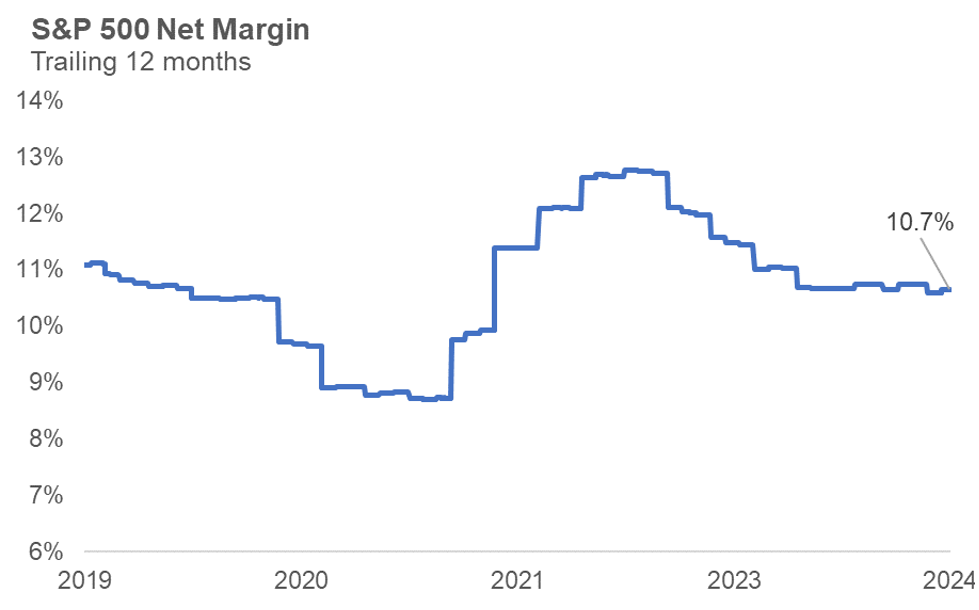
We cannot review the fundamentals of any company without looking at its income statement. Earnings, revenues, and future expectations often get all the attention during earnings season. But just as important for the health of a company, industry, and broader corporate America are margins. Net margins show the percentage of top-line sales/revenues that become earnings (profit) after expenses. Higher margins are preferred, and we’ve seen an upward movement in the absolute level of margins across the market due to the rise of technology companies that generally have wider margins due to the scalability of their businesses.
As companies report earnings, an updated picture of margins across the index emerges. Margins are generally a very stable series, but as the chart below shows, the last five years have seen significant movement. From the pandemic lows to the euphoria of 2021, followed by rising inflation in 2022 and 2023, the margin roller coaster has flattened out at a healthy level just under 11%.
The importance of margins extends to future earnings growth. All else equal, the more margin cushion a company has, the more it can stretch its revenues into stronger future earnings. Another healthy sign is 55% of S&P 500 companies increased their profit margins during the quarter.
Source: Factset, Carson Investment Research 3/28/2024
Valuations
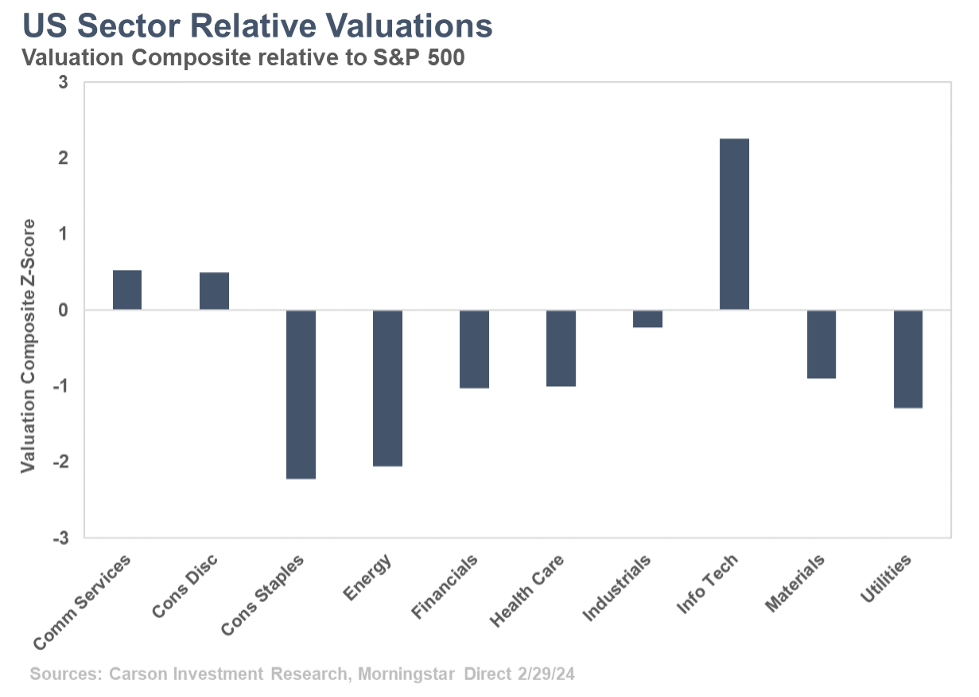
Revenues, earnings, margins, and other fundamental factors all contribute to the valuation of a company. We can view this at several levels — company, sector, index, or country. One important way to view valuations is through earnings of various asset classes relative to the broader market and their own history. There are always reasons some areas are over- or under-valued at certain periods of time, and we do not use valuations as a timing mechanism. But it is important to review where we can find value as there are years, such as 2022, when investors reward lower valuations.
A composite of valuation metrics relative to the S&P 500 index shows technology and technology-related sectors have higher valuations relative to their history. Information technology is nearly two standard deviation points overvalued or higher than all but just over 2% of its history. Defensive and cyclical sectors are trading at discounts relative to the rest of the market and their own history.
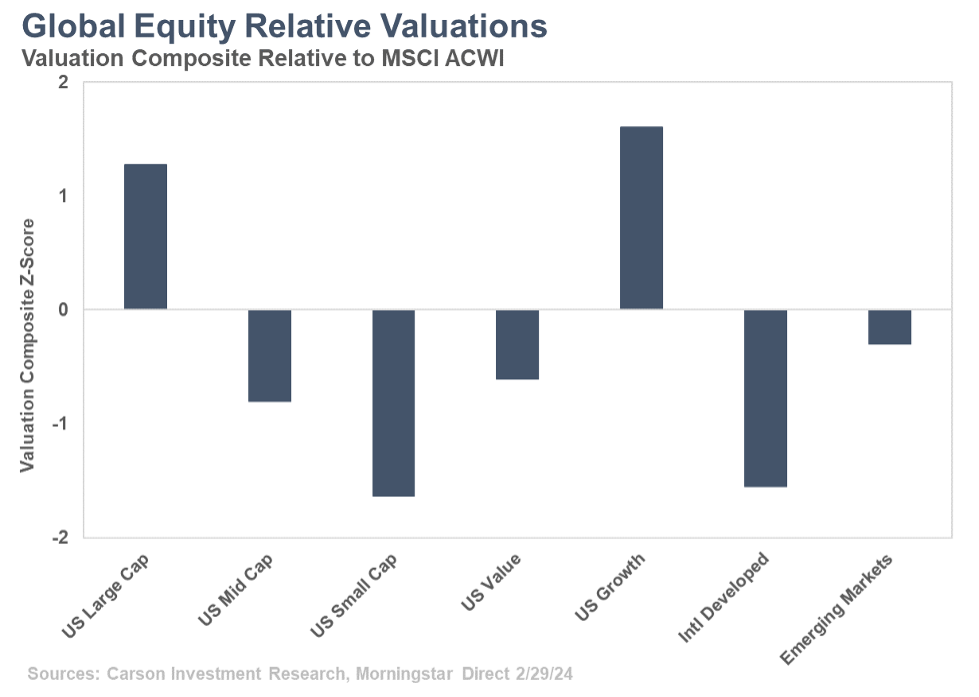
Globally, the same methodology can be applied to broad equity asset classes relative to the global index. Here we continue to see significant valuation discounts in domestic, small- and mid-cap stocks, especially given the dominance of large-cap growth in the global index.
While some areas of the market show above-average valuations, their strong earnings support can keep valuations elevated for some time. We are emphasizing a broadening of market returns, which also can be met with strength in the underlying earnings of these companies. Keeping an eye on the fundamentals of the market from both a bottoms-up and a top-down macro perspective uniquely positions the Carson Investment Research team to add value for our advisors and their clients.
This newsletter was written and produced by CWM, LLC. Content in this material is for general information only and not intended to provide specific advice or recommendations for any individual. All performance referenced is historical and is no guarantee of future results. All indices are unmanaged and may not be invested into directly. The views stated in this letter are not necessarily the opinion of any other named entity and should not be construed directly or indirectly as an offer to buy or sell any securities mentioned herein. Due to volatility within the markets mentioned, opinions are subject to change without notice. Information is based on sources believed to be reliable; however, their accuracy or completeness cannot be guaranteed. Past performance does not guarantee future results.
S&P 500 – A capitalization-weighted index of 500 stocks designed to measure performance of the broad domestic economy through changes in the aggregate market value of 500 stocks representing all major industries.
The NASDAQ 100 Index is a stock index of the 100 largest companies by market capitalization traded on NASDAQ Stock Market. The NASDAQ 100 Index includes publicly-traded companies from most sectors in the global economy, the major exception being financial services.
A diversified portfolio does not assure a profit or protect against loss in a declining market.
Compliance Case # 02190214_040824_C


